Maximizing Sales Opportunities in Food Distribution: Grower's Organic
A Denver-based food distributor specializing in connecting the public to local and regionally grown produce.


Overview
A Denver-based food distributor specializing in connecting the public to local and regionally grown produce. The company is passionate about fresh food and embraces a personal, community-driven approach to fresh produce distribution. While the company does use inventory management software, it does not provide all the information needed for the business to grow.
The Opportunity
Problem 1: Lost Revenue from Inventory Management The Client was losing potential income due to a lack of inventory management related to order fulfillment. The company's inventory management system was not sophisticated enough to interpret customer demand over time – leaving money on the table. Problem 2: Lost Revenue from Client Management The sales team could not analyze its customers and their buying trends quickly. As a result, some accounts that needed nurturing were left untended, and sales opportunities were lost. |
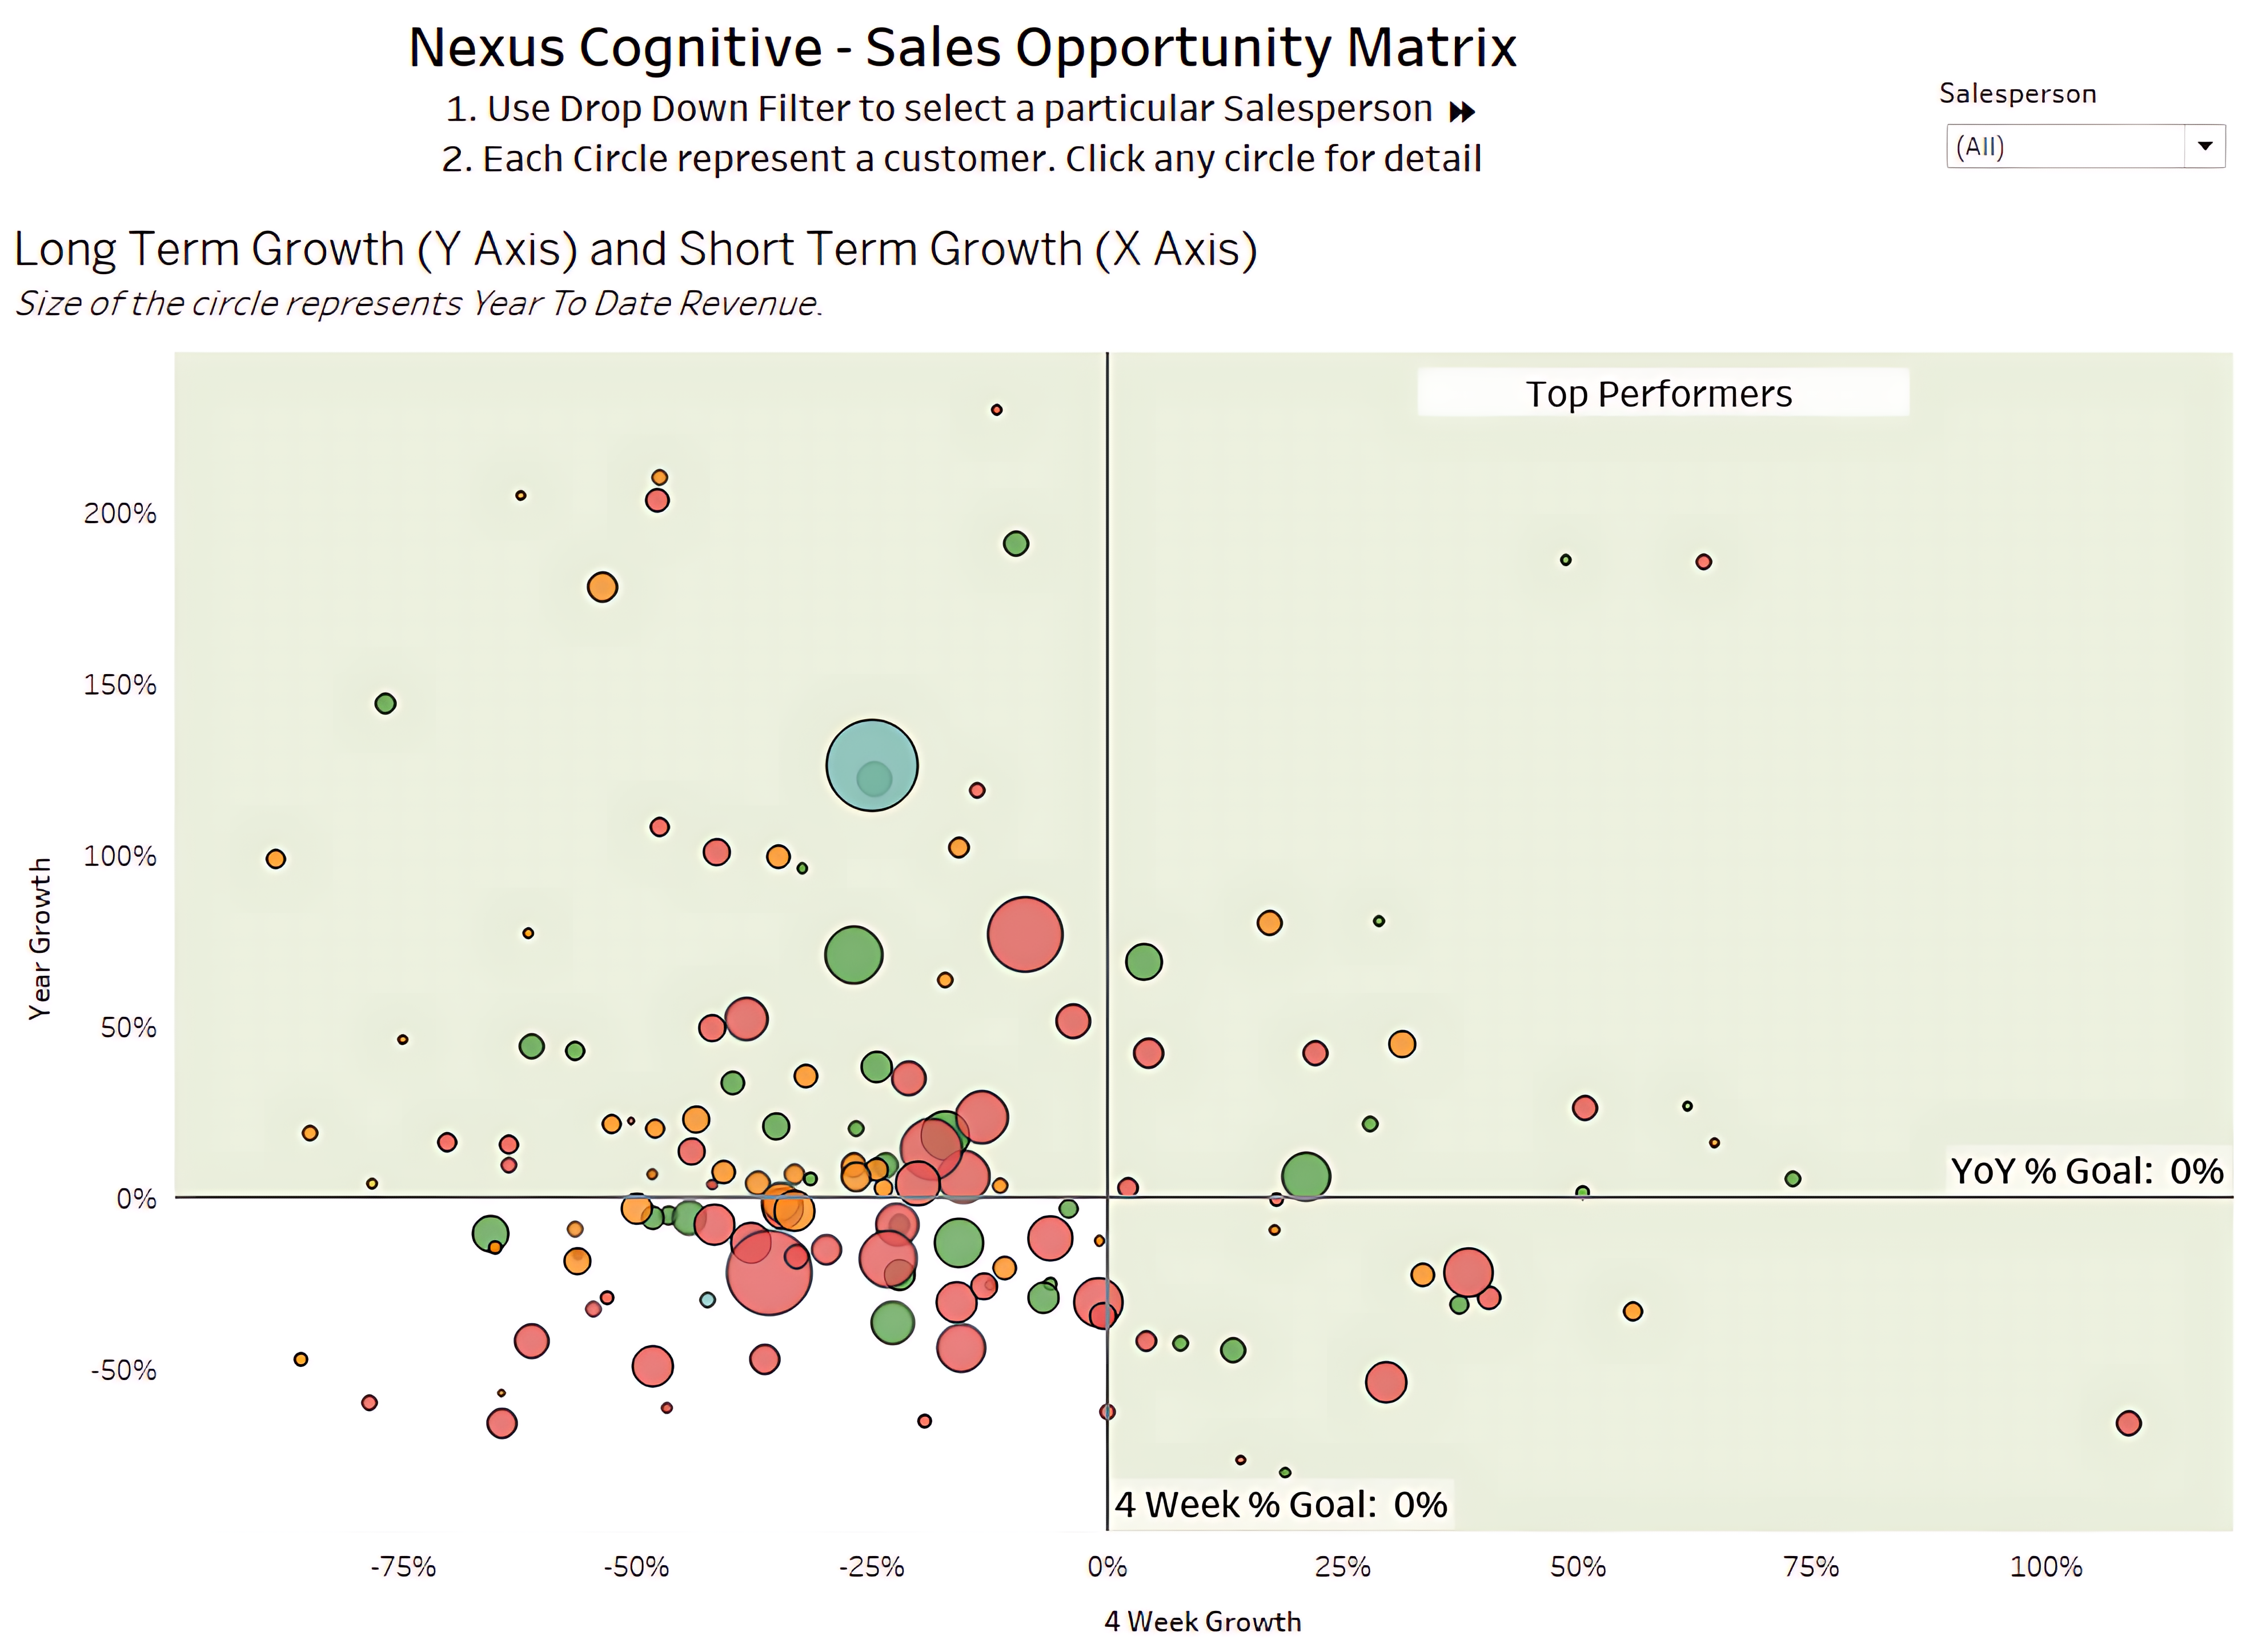
EZ Analytics created a visualization that helped the sales team understand customer ordering trends to facilitate a conversation and nurture client relationships.
The Solution + Results
Solution 1: Nexus deployed EZ Analytics to combine the companies sales and inventory data to provide automated reporting to predict customer demand. Nexus leveraged predictive analytics to identify customer order trends to focus on proper inventory management. Grower's Organic now understands the demand for specific products over time and seasons to lower inventory risk and make better purchasing decisions. Solution 2: EZ Analytics created a visualization that helped the sales team understand customer ordering trends to facilitate a conversation and nurture client relationships. Being proactive allowed the company to react to dips in revenue more quickly and build stronger relationships. An example of the scatter-plot visualization is provided below: |
Educational Non-profit Data Compilation
Shopping Cart Analysis – Liquor Store Insights